What Investors Actually Look for in Your Financials Before Writing a Cheque
Before investors write a cheque, they dissect your financials. Discover what they actually look for in your P&L, balance sheet, cash flow and KPIs — and how to present numbers that build confidence, not doubt.

Raising capital in today's market is not what it was three years ago. The days of a compelling pitch deck and a charismatic founder story being enough to land a term sheet are well behind us. In 2025 and into 2026, investors — whether venture capitalists in San Francisco or angel syndicates in London — want precision, clarity, and reliability, especially when it comes to your financials. If you are a founder preparing for a fundraise, understanding exactly what sits on the other side of the table is not optional. It is the difference between a cheque and a polite pass.
The Shift in Investor Expectations
The fundraising climate has fundamentally changed. Tighter capital markets, higher interest rates, and high-profile startup collapses have made investors more cautious and more forensic in their approach. Today's investors want to see sustainable, data-backed growth — not just top-line revenue numbers. Flashy slides will get you in the door. Your financials will decide whether you leave with a term sheet.
The first thing most investors ask for is simple: your historical financials. This typically means a breakdown of performance over the last 12 to 24 months covering your income statement, balance sheet, and cash flow statement. If these are not prepared, reconciled, and organised before you approach investors, it is an immediate red flag. It signals that financial management is not a priority — and that is a business risk, not just an administrative one.
Revenue: Quality Beats Quantity
One of the most common mistakes founders make is treating revenue as a single number. Investors do not. They disaggregate revenue into tiers: fully contracted recurring revenue (MRR/ARR under multi-year agreements), quasi-recurring income, and transactional or one-off revenue. Only contracted recurring revenue receives full credit in valuation discussions. The difference in multiple is not marginal — across more than 3,000 private software transactions in 2024, SaaS businesses with strong recurring revenue achieved a median EV/EBITDA of 19.2x, an 88% premium over the all-software median of 10.2x.
This is why Monthly Recurring Revenue (MRR) and Annual Recurring Revenue (ARR) are foundational metrics in any investor conversation. They are not just accounting figures — they represent the predictability of your business. Investors scrutinise revenue trends for growth rate, composition, and quality. Is your growth organic or artificially inflated by one-off deals? Are you expanding within your existing customer base, or constantly replacing customers who leave?
Churn Rate: The Metric That Kills Deals
Churn rate is one of the most brutally honest metrics in your financials. It measures the rate at which customers or revenue is lost over a given period. A high churn rate signals a product-market fit problem, a customer success failure, or a pricing issue — none of which investors want to inherit. Net Revenue Retention (NRR) above 120% can more than double the achievable multiple in an M&A or fundraising context; churn above 10% annually compresses multiples by 1 to 3x.
Investors want to see you track both gross and net revenue churn. Net churn can actually be negative — a strong positive signal — if expansion revenue from existing customers exceeds cancellation losses. If you are not already tracking this, build it into your financial reporting immediately. It costs nothing but time, and the upside at the negotiating table is significant.
For any startup that has not yet reached profitability, burn rate and cash runway are existential metrics. Burn rate is the rate at which your company spends its cash reserves before reaching positive cash flow. Investors look at both gross burn (total monthly outflows) and net burn (expenses minus revenue). A SaaS startup spending $100,000 per month with $30,000 in revenue has a net burn of $70,000 — and if it has $700,000 in the bank, its cash runway is 10 months.
According to PitchBook's 2025 State of Venture data, 42% of founders cannot accurately assess whether their burn rate is competitive within their industry — a dangerous blind spot that directly impacts fundraising conversations. Benchmarks vary significantly by stage: seed-stage SaaS startups burn a median of $80,000 per month, while fintech companies burn $120,000 and hardware startups up to $200,000 per month. Knowing where you sit relative to these benchmarks is basic preparation for any investor meeting.

The broader rule of thumb for runway has also shifted. While 18 to 24 months was once considered adequate, in today's tighter funding environment investors increasingly expect 24 to 36 months of runway — and will scrutinise startups with less than 6 months of cash remaining particularly carefully.
Unit Economics: The Foundation of Scalability
Unit economics is the discipline that separates businesses that can scale profitably from those that are simply spending their way to growth. At its core, it answers one question: does acquiring a customer generate more value than it costs? Two metrics anchor this analysis: Customer Acquisition Cost (CAC) — the fully loaded cost of acquiring a single customer — and Lifetime Value (LTV), the total revenue that customer generates over their relationship with your business.
The benchmark LTV:CAC ratio most investors use is 3:1 or higher — meaning that for every $1 spent acquiring a customer, the business should generate at least $3 in lifetime value. By Series A, investors expect a clear path to 3:1. By Series B, anything below this threshold raises serious questions about scalability. A ratio of 1:1 means you are spending a dollar to make a dollar — which is not a business model, it is an expensive treadmill.
The CAC payback period is equally important. For SaaS businesses, investors typically want to see payback within 12 months. A shorter payback period means faster reinvestment in growth and reduced customer churn risk. If you are paying $300 to acquire a customer and generating $50 per month at 80% gross margin, your payback period is 7.5 months — a strong signal to investors.
Gross margin — the percentage of revenue remaining after direct costs — is one of the most critical indicators of business model scalability. It is literally the glass ceiling of profitability: your net margin can never exceed your gross margin. Most software businesses operate at gross margins of 80% or above, making them highly attractive to investors. A gross margin of 60% or lower for a software company immediately prompts questions about cost structure and scalability.

EBITDA (Earnings Before Interest, Taxes, Depreciation, and Amortisation) measures operational profitability and allows investors to compare companies across industries on a standardised basis. For early-stage startups, negative EBITDA is expected and acceptable — the question investors ask is whether there is a credible path to positive EBITDA, and when. Founders who can model and defend that path with assumptions grounded in unit economics and market data earn significantly more investor confidence than those presenting hockey-stick projections without supporting logic.
Financial Controls and Red Flags
Beyond the numbers themselves, investors assess the quality of your financial management. Clean, accurate financial records, professional financial management practices, and transparent reporting are baseline requirements. Red flags that derail deals include incomplete or inaccurate records, poor internal controls, inconsistent reporting methodologies, and a lack of financial planning infrastructure.[^2]
Segregation of duties — ensuring different people handle different financial functions — is increasingly scrutinised, even in early-stage companies. The introduction of documented approval processes and audit trails signals operational maturity. At due diligence stage, investors will dig into tax returns, payroll records, and vendor agreements. Having these organised and accessible in advance is not just professional — it materially shortens the due diligence timeline and reduces deal fatigue.
Sophisticated investors — and this includes most institutional VCs and professional angel investors in the US and UK — will want to see all three financial statements: income statement, balance sheet, and cash flow statement. The income statement shows whether the business is profitable on an operating basis. The balance sheet reveals what the company owns, owes, and how it is financed. The cash flow statement shows the actual movement of cash — which can diverge dramatically from accounting profit when deferred revenue, receivables, or capital expenditure are involved.
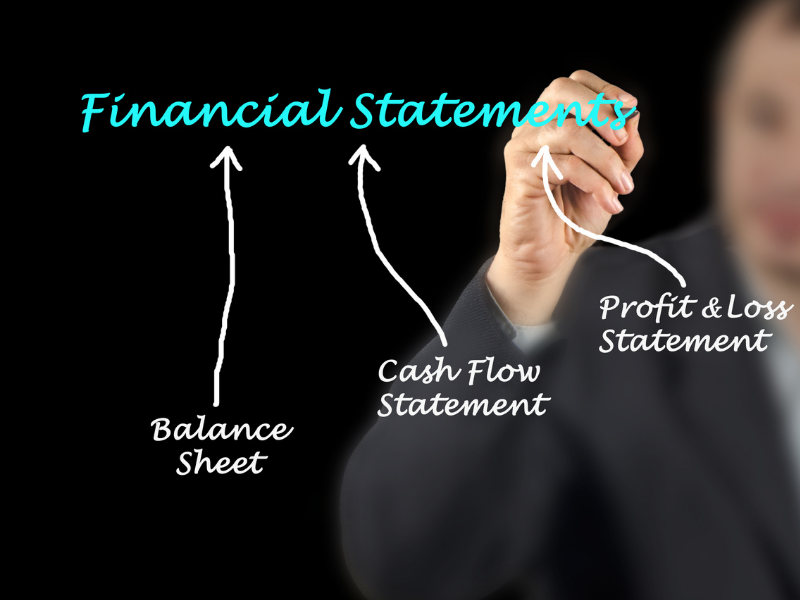
Founders who can speak to all three fluently — explaining the relationships between them and what they reveal about the business — demonstrate a level of financial literacy that builds investor confidence disproportionate to the effort involved. If you cannot yet do this, it is an investment of time worth making before your next investor meeting.
What Investors Are Not Just Looking For
It is worth noting that investors are not solely investing in your financial performance — they are investing in your financial management capability. The way you present, discuss, and defend your financials is itself a signal about how you will manage capital going forward. Founders who arrive with clean books, well-organised data rooms, credible projections built on defensible assumptions, and the ability to answer hard questions about their unit economics consistently outperform those who treat financial preparation as an afterthought.

In 2026, the bar for raising capital is higher than it has ever been. The founders who clear it are not necessarily those with the best products — they are the ones who understand their numbers well enough to tell a compelling, credible, and verifiable financial story.
If you are reading this and realising your numbers, governance and ownership docs are not in the shape you want before talking to investors, you do not have to guess what to fix first. The Investor – Ready Finance Checklist for Founders is a practical, one‑pager‑at‑a‑time roadmap to get investor‑ready before you send a single spreadsheet out.
It walks you through the exact areas covered in this article — from finalising your latest P&L, balance sheet and cash flow statement, to tightening working capital and revenue completeness, setting up a simple founder KPI dashboard, and making sure your governance rhythm, tax compliance and cap table (including SAFEs and options) are clear and documented. You also get a forward‑looking section to build a 12–24 month forecast, cash flow runway view and “Use of Funds”, plus a final page to pull it all together into your 3–5 sentence numbers story and top 3 gaps to fix next — so you go into funding conversations prepared, not defensive.
Use the Investor – Ready Finance Checklist for Founders every time you are about to send your numbers to investors, lenders or potential partners, and you will catch red flags early, tell a cleaner story, and feel more confident answering tough questions about your numbers and governance. Access the Investor-Ready Finance Checklist here.